
Site managers are using a combination of occupancy and environmental data to drive conversations around what type of workplaces are best suited to their organisation.
Using sensors to gather data is a cost-effective and convenient way to get a lot of information quickly. It gives facility management teams an objective and realistic view of how buildings and workspaces are utilised.
Having concrete data takes away the guesswork and provides a view of space utilisation as well as:
- Allow for easier conversations with department heads and HR
- Use historical patterns to forecast future growth
- Manage the delicate balance of ‘just right’ utilisation
Utilisation sensor types
There are a number of different types of utilisation sensors that are used in offices, the sensor choice, as well as the number of sensors installed, is based on the desired end goal. Desk and meeting room sensors capture real-time occupancy data and are one method used to increase workspace utilisation.
Desk and phone booth sensors
They use passive infrared sensors (PIR) which is triggered by both motion and heat i.e. no personal or health information of an individual is captured. The data is anonymised to illustrate utilisation enabling real estate and facility teams to understand individual desk occupancy and see aggregate data for departments. Installed under desks they are out of sight and not disruptive to employees.
Meeting room presence
For smaller meeting rooms especially presence, sensors using grid eye PIR technology enables the facility managers to understand the utilisation of meeting rooms. The main purpose is to understand if common complaints of not enough meeting rooms is due to actual lack of rooms or due to inappropriate use of booking software and meeting no shows. From this the site manager can understand which types of meeting rooms are the most popular in the portfolio.
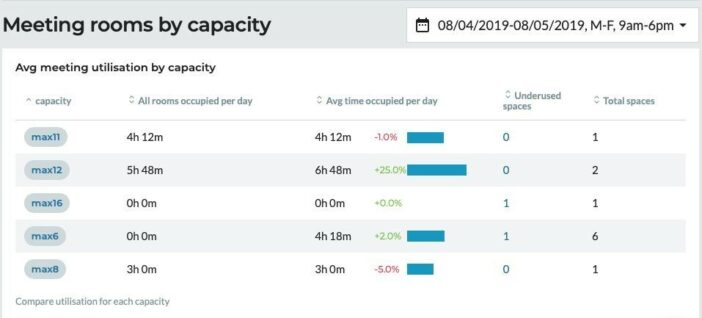
Figure 1: Meeting rooms by capacity
Meeting room counting sensors
Meeting room counters are usually used for larger meeting rooms of over 5+ capacity. These sensors tell the user about not just presence but also the number of people using the meeting room at any given time. These sensors answer the question around whether meeting rooms are right sized or if 1-2 people are regularly using a large boardroom style office.
In the example below you can see that a meeting room of 12 people is being mostly used by groups of 3.
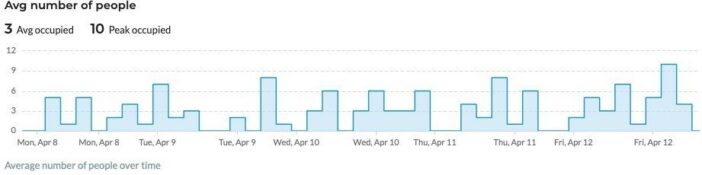
Figure 2: Average number of people
Footfall counters
Footfall counters allows the site manager to understand the usage of open areas and create zones around a building. Standalone neighbourhoods and zones are a common way to design activity based workplaces with their own facilities including break out and collaboration areas as well as kitchen facilities. Understanding if you have enough space necessary for each neighbourhood and whether these critical areas are being used is essential.
Benefits of sensors over manual surveys.
- Sensors are less disruptive
- Much more cost effective and efficient
- They have lower error rate
- Give you a wider scope of occupancy usage
- Reports are automatically generated
With the automation of occupancy data capture, this frees up real estate or facility managers to focus on the value added strategic activities.
Analysing data points
Heat maps and sensors can help determine predictable patterns of usage including peak demand for:
- Desks – capture real time information of desks that are in use and those that are available
- Conference and meeting rooms – have oversight of whether you have the appropriate amount of meeting rooms and whether they are the right size
- Break rooms – understand where tenants/employees tend to go and hang out as well as whether they are over or under utilised to help plan future redesigns
- Corridors and hallways (footfall monitors) – monitor paths through the office or building to assess trends as to why some are more used than others
Some of the key metrics to analyse are:
- Average utilisation rates of desk, meeting rooms or shared spaces
- Identify peak off peak utilisation rates
Determine the person to desk ratio
- Utilisation comparison between buildings, floors, departments or teams
Using data enables more accurate planning and by making it available to occupants, you enable them to both change their behaviour and shift conversations from ‘how many desks do you need’ to ‘how can you use your space more productively’.
Why workspace utilisation is important
Buildings are the second largest cost for any organisation. The average workstation in Central London costs £17.5k pa ($22.5k pa) according to Cushman & Wakefield, yet the average desk utilisation rate is 45%. Based on an office space with 500 workstations, businesses could be losing as much as £5M a year on unused space.
Additionally, buildings contribute a large amount of the world’s greenhouse gases and many organisations need to find effective ways to reduce their carbon footprint whilst optimising the current use of their workspace.
The design of the office space has a high amount of impact on
- The happiness and productivity of employees
- Drive value and cost for the business
- Enabling meeting of sustainability goals
It is important we get office space design right and we at OpensSensors believe that facilities and workplace managers are going to be the critical levers in executing on these goals.
Key takeaways
- Embrace data and technology – the workforce is evolving and its critical to adapt to the changing work patterns and
- Measure the right metrics against your hypothesis in order to see shifts in your workplace utilisation
- Maximise workspace utilisation to reduce your carbon footprint and adapt to the modern workplace